Why the Single Round Chart Elevates Your Data Presentations
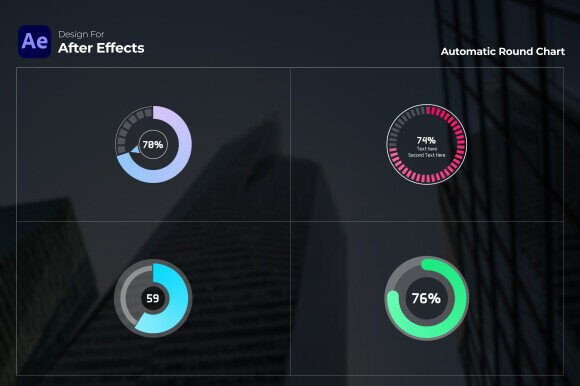
Numbers alone rarely inspire. What grabs attention, holds it, and drives a point home is how those numbers are shown. The Single Round Chart — more formally the Single Gradient Round Chart template for After Effects — is built for exactly that moment. It’s a sleek, ready‑to‑use infographic resource that wraps your hard data in a polished, modern gradient style. Instead of wrestling with complex design software or settling for a static spreadsheet screenshot, you open the template, enter your values, and watch a high‑impact visual appear. Marketers, business analysts, educators, and content creators all turn to tools like this because they know a single clear chart can replace three paragraphs of explanation.
But owning a template is not the same as using it well. Too many sharp professionals download perfectly good assets and then sabotage their own work through rushed decisions or small misunderstandings. This article walks through the most common slips people make when choosing and applying a data visualization template, and how the Single Round Chart can help you sidestep them cleanly. Whether you’re building an annual report, a pitch deck, or a YouTube explainer, the goal is the same: let your data speak without distraction.
The Quiet Trap of Overcomplication
A frequent error is believing that “more” equals “better.” In an attempt to impress, a creator might stack five different chart styles onto one slide, layer in loud animations, or mix half a dozen color palettes. The result? Viewers squint, tune out, and miss the core message entirely. The Single Round Chart keeps things focused. It’s a single, elegant ring or donut‑style graphic designed to spotlight one key dataset at a time — say, market share percentages, survey responses, or budget allocation.
When you spread attention too thin, clarity takes the hit. With a round chart, the eye naturally follows the arc, instantly grasping proportions. The built‑in gradient style of this template adds depth, but it doesn’t overwhelm; the transitions between shades are soft and intentional. By resisting the temptation to clutter, you allow the audience to absorb the numbers without cognitive strain. A practical rule: if you can’t summarize the chart’s takeaway in a single sentence, it’s trying to do too much. Start with one well‑designed round chart and see if anything else is truly needed.
Neglecting the Real Cost of Manual Updates
Think about a quarterly sales deck that someone updates by hand. Numbers get copied from a spreadsheet, chart elements are dragged, labels are retyped, and colors are eyedropped to match the brand. A single digit‑transposition can turn a promising meeting into an awkward correction email. Yet many creators still default to this grind because they assume a template will be rigid or demand coding.
The Single Round Chart includes an auto value calculation feature. You input your data — just the raw numbers — and the chart updates instantly. The percentages, the segment sizes, the call‑out figures: all adjust automatically. This isn’t just a time‑saver; it’s a risk‑saver. Manual tweaking introduces errors, and errors erode trust. When you present a flawlessly updated infographic, your audience doesn’t just see the data; they see that you take accuracy seriously. For a freelancer invoicing a client or a brand manager presenting to stakeholders, that subconscious confidence is worth far more than the minutes you saved.
Avoiding the Plug‑in and Font Pitfalls
Opening a freshly downloaded template only to be greeted by a missing‑plugin error is deflating. It means pausing work, hunting down a third‑party tool, possibly paying for it, and hoping everything renders as promised. The Single Round Chart requires no plugins. It runs natively in After Effects CC 2023 and above. That straightforward compatibility keeps your workflow fluid and your project files portable. If you share the project with a colleague or open it a year later, you won’t be revisiting old installations.
There’s a parallel snag with fonts. A stunning template can fall flat when the typography fails to load because the user didn’t have the right typeface installed. The free font link provided with this template removes the guesswork. You simply follow the included link to download the exact fonts used in the design. Doing this before you even open the After Effects project prevents the jarring moment where your beautifully curved chart is paired with a default system font that throws off the whole balance. Missing fonts aren’t a detail; they warp spacing, alignment, and professional feel. The ten minutes you invest in installing the linked fonts will echo through every render you make.
Choosing Style That Outlives a Trend
A common oversight is picking a chart aesthetic purely because it looks “cool right now.” Neon glows and extreme 3D bevels might feel exciting, but they date quickly and often clash with corporate or educational settings. The gradient style of this template strikes a deliberate middle ground. It’s contemporary but not disposable. The smooth color transitions add warmth and polish without screaming for attention. This makes the Single Round Chart a safe, smart choice for business reports, marketing presentations, and academic videos alike.
Before you commit to any template, open a sample preview with your own brand colors in mind. The chart is fully customizable, so you can tweak the gradient stops to match a brand palette in seconds. What you’re checking is whether the underlying design structure — the line weights, the label placement, the proportion of the circle — reads clearly at the intended screen size. A Full HD 1920x1080 export, which this template supports, will look crisp on most modern screens and projectors. If you’re presenting on a large conference display, test a short clip at that resolution to ensure no thin lines vanish.
When “User‑Friendly” Is Misunderstood
“User‑friendly” can mean very little until you dig into what it actually covers. For some, it means drag‑and‑drop simplicity; for others, it means editable without breaking expressions. The Single Round Chart was designed for both beginners and seasoned professionals. If you’re still gaining confidence in After Effects, the template’s structure lets you locate the main data controls quickly — typically within a clearly named composition or a controller layer. If you’re an experienced motion graphic artist, you can dive deeper, adjusting timing curves, tweaking the gradient ramps, or nesting the chart within a larger infographic sequence.
The mistake is assuming that “user‑friendly” means you can skip reading any accompanying guide. Even with the most intuitive template, spend ten minutes opening every comp and spotting where the data input fields live. A quick test with placeholder numbers will reveal exactly where the auto calculation happens. This small upfront tour prevents the head‑scratching moment midway through a tight deadline when something doesn’t update as expected. The template performs reliably; you just need to know where to land your clicks.
Overlooking Data‑to‑Chart Fit
A beautiful round chart will still confuse an audience if the data doesn’t suit the format. Round charts — especially donut or ring styles — work best for part‑to‑whole relationships. Displaying a trend over time with a round chart is generally a mismatch; your viewers will struggle to compare the sizes of segments across multiple years. If you need to show quarters within a single year, a round chart can be perfect. But if you intend to show sales growth month over month, a bar or line chart tells that story faster.
A practical approach: list the one insight you want the audience to remember, then ask if a round chart communicates it naturally. The Single Round Chart template excels precisely when you have proportional data — category splits, demographic segments, budget breakdowns. When used correctly, the visual becomes intuitive. When forced onto incompatible data, it creates friction. This isn’t a template flaw; it’s a design principle that saves you from building something that looks polished but fails to inform.
Ignoring the Pre‑Decision Checklist
Before you download or purchase any infographic template, a quick self‑check prevents disappointment. The Single Round Chart is well‑specified, but you should still verify how it fits your environment. Consider these points:
- After Effects version: You must be on CC 2023 or newer. If your team standardizes on an older version, this template won’t open properly.
- Resolution needs: The asset is 1920x1080. If your final output is 4K, you’ll need to scale it after rendering or confirm that upscaling looks acceptable.
- Font integration: Are you able to install free fonts on your machine? On some locked‑down corporate systems, you may need an early conversation with IT.
- Data structure: Do you have 3–8 data points that represent parts of a whole? A single round chart handles a handful of segments elegantly. If you have dozens of tiny categories, the labels become unreadable.
- Animation intent: The template is likely animated with a clean reveal or draw‑on effect. If you need a completely static image, you can still use it but you’ll export a single frame. If you need a long animated loop, check how the timeline is structured to avoid abrupt resets.
Going through even three of these checks will put you ahead of the typical user who scrambles at the render stage. The template’s strength is its blend of elegance and practicality; those strengths land best when they match your real‑world parameters.
How Small Decisions Shape Viewer Trust
Every element in a data presentation sends a signal. A misaligned label whispers “carelessness.” A jarring color suggests the creator didn’t consider readability. The Single Round Chart, with its gradient sophistication and auto‑calculation, helps you avoid those amateur marks. But the tool is only half the equation. The other half is your own diligence in setting up the data clearly, choosing segment colors that color‑blind viewers can differentiate (providing patterns or high contrast where needed), and keeping the on‑screen supporting text concise.
For example, an educational video about renewable energy could use the chart to display global energy mix percentages. Instead of labeling every tiny slice, the creator can use the template’s clean call‑outs for the three largest segments and group the rest under “other.” The gradient shades make even the “other” slice feel intentional rather than an afterthought. That’s where the template’s design vision pays off — it handles the aesthetic heavy lifting so you can concentrate on the story.
Making the Most of Time‑Saving Features
The promise of a time‑saving template only holds true if you don’t spend hours reverse‑engineering how the automation works. The Single Round Chart is built to streamline your workflow, but a little upfront familiarization goes a long way. Open the template on a low‑stakes practice day and deliberately break things: what happens if you input a zero? How does the chart react if you move a keyframe? Knowing these boundaries means you won’t be learning them at 1 a.m. before a morning deadline.
The auto value calculation is the standout feature here. It eliminates the tedious math of converting raw numbers into percentage slices and animating each one independently. But remember, the output remains calculated based on the numbers you feed in. Double‑checking the source data is still your responsibility. The template’s job is to render it beautifully; your job is to ensure it’s correct. When you pair sound data hygiene with this template’s polished engine, you get a result that feels both authoritative and modern.
Stepping Forward with Confidence
Data doesn’t have to be dry. The Single Gradient Round Chart template leverages gradient styling, automatic updates, and a plugin‑free environment to turn raw figures into a compelling visual asset. But its real value shines when you avoid the common ruts: overcomplicating the layout, ignoring font and version requirements, forcing round charts onto time‑series data, and skipping the pre‑import checks. Each of those missteps can sap the professionalism from an otherwise strong presentation.
Treat the template as a partner in clarity. It brings the design sophistication and mechanical ease; you bring the accurate data and the storytelling judgment. When used with care, a single round chart can do what pages of bullet points never accomplish: make your audience stop, understand, and remember. The template is fully customizable, so experiment with your brand’s gradient palette, test a few label positions, and render a short sample review. The few minutes you invest in that polish will amplify the impact every time you present.